A high night flow or a balance that will not close usually points to leakage. Two investigations show what it costs when it does not, and how analysts and field teams found where the water was really going.
When a district’s night flow sits above target, or a trunk main balance shows water going missing, the usual assumption is leakage, and the usual response is to send a team out to find it.
Sometimes the assumption is wrong. The water is being used, or the data describing the network does not match what is in the ground. When that happens, two things go wrong at once. Survey teams spend time looking for leaks that are not there. And the reported leakage figure stays higher than it should be.
Two investigations by our analysts and technicians show what it takes to get to the real answer.
Case one
The trunk main
What it looked like: a balance with a large volume of unaccounted-for water.
What it was: a long-standing error in the GIS records.
Case two
The district
What it looked like: a night flow running above target for a long time.
What it was: business customers using water through the night.
The trunk main that would not add up
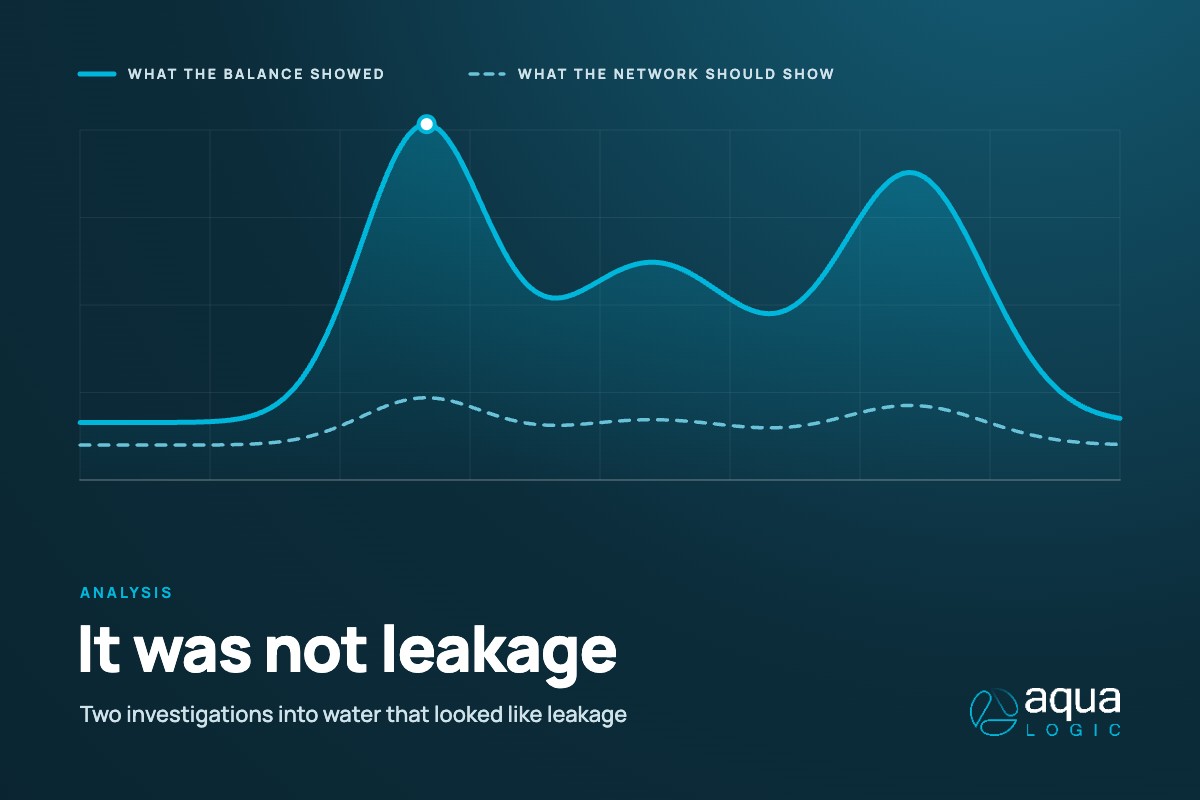
The first case started with a trunk main being prepared for live leakage reporting. Its balance showed a volume of unaccounted-for water, with a clear daily pattern rising and falling through the day.
A daily pattern is not unusual on a trunk main. The size of it was. Checked against the length of main and the number of properties connected, the profile was far larger than the network could explain. Before sending anyone out to sweep for leaks, the analyst set out to work out whether the water was leakage, consumption, a data problem, or some mix of the three.
The analyst worked through the possible explanations in turn.
- 01Check the recordsA trace of the mains confirmed the balance matched the GIS records, and every import and export was set up correctly.
- 02Test the metersDifferent scale factors were tested on each meter, alone and in combination. Every change made the balance worse.
- 03Check the neighboursDownstream balances confirmed the export data was sound. Upstream balances could not be used because of their own metering problems.
- 04Ask the people who know the areaLocal network staff were asked about new estates or properties that might explain the demand.
- 05Form a theory and prove itScenario balances pointed to a meter that was not where the records said it was. The technician went to site to test it.
That last step was not easy. The metering chambers were rural, overgrown and hard to find. Working from a schematic and a clear field plan prepared by the analyst, the technician located the chambers, lifted the lids, and confirmed how the network was set up on the ground. A theory is not enough to report on, and this one had to be proved.
It was. The cause was a long-standing error in the GIS records. Once the balance was corrected, the daily profile dropped to match what the network should show. With a realistic target finally known, the technician then carried out a leakage sweep and found the genuine bursts that remained, bringing the balance down to its lowest recorded level.
The district that kept running high
The second case was a large district metered area with a mix of households and large business customers. It had long been suspected of running above target. With little sub-metering inside it, nobody could split the night flow to see whether the problem was long-term leakage, legitimate use, or both.
The work started with a meeting with the water company to gather what local teams knew about the area, including leads that had only ever been anecdotal. That knowledge was combined with network data to plan a targeted investigation, rather than working from the night flow alone.
A survey of the whole district set the baseline and found leaks along the way. The team then identified every non-household customer in the area and cross-checked them against GIS and billing data to produce a shortlist of meters worth a closer look.
Each meter went through the same steps. The analyst confirmed its location on GIS. The technician found it on site, surveyed it to work out what logging equipment it needed, and took a reading. A second visit gave a second reading and a first view of consumption. Where the evidence justified it, the meter was logged, and the analyst reviewed the logged profile to separate steady customer use from possible leakage.
Two customers stood out. Both were using substantial volumes of water through the night, and that use had been sitting in the night flow, inflating the district’s leakage position.
Accounting for it changed the picture of the district. The reported leakage position became more accurate, and because that consumption is now identified, it will stop distorting the leakage signal in future. The next round of leakage work can be aimed at the leakage that is there.
What the two cases have in common
Both answers came from working through the possible explanations one at a time, ruling each one out with evidence rather than assumption, and keeping going after the obvious options were exhausted.
Both also depended on the analyst and the technician working as one team. The analyst could narrow the problem down from the data, but only someone on site could lift a chamber lid, find a meter or take a reading. The analyst’s plan told the technician what to look for and why. Neither would have got there alone.
And both show why the quickest response is not always the most useful one. When the volume is not leakage, a sweep finds little and the reported figure stays wrong. Taking the time to understand the data first, and to prove it on the ground, is what makes the leakage work that follows worth doing.
Evidence before assumption
Be sure what a number describes before acting on it.
It is the same principle behind how we survey: record what was checked, prove what was found, and treat the gaps as things to investigate rather than fill with a guess.