For three years Aqualogic has run connected leakage workstreams for a UK water company, from pressure management and DMA performance to trunk mains and digital survey. In the second quarter of 2026/27 the programme offset 38.49 megalitres a day of leakage increase. The longer trend says more about how leakage is kept down.
The client’s network is demanding to manage. The topography is complex, much of it is rural, and experienced leakage technicians are hard to recruit locally.
Leakage does not stand still on any network. Assets deteriorate, background leakage grows and seasons put pressure on pipes, so new leakage keeps emerging. The industry calls this the Natural Rate of Rise. Any leakage programme has to offset it before it can bring the baseline down, and stopping work lets it climb back.
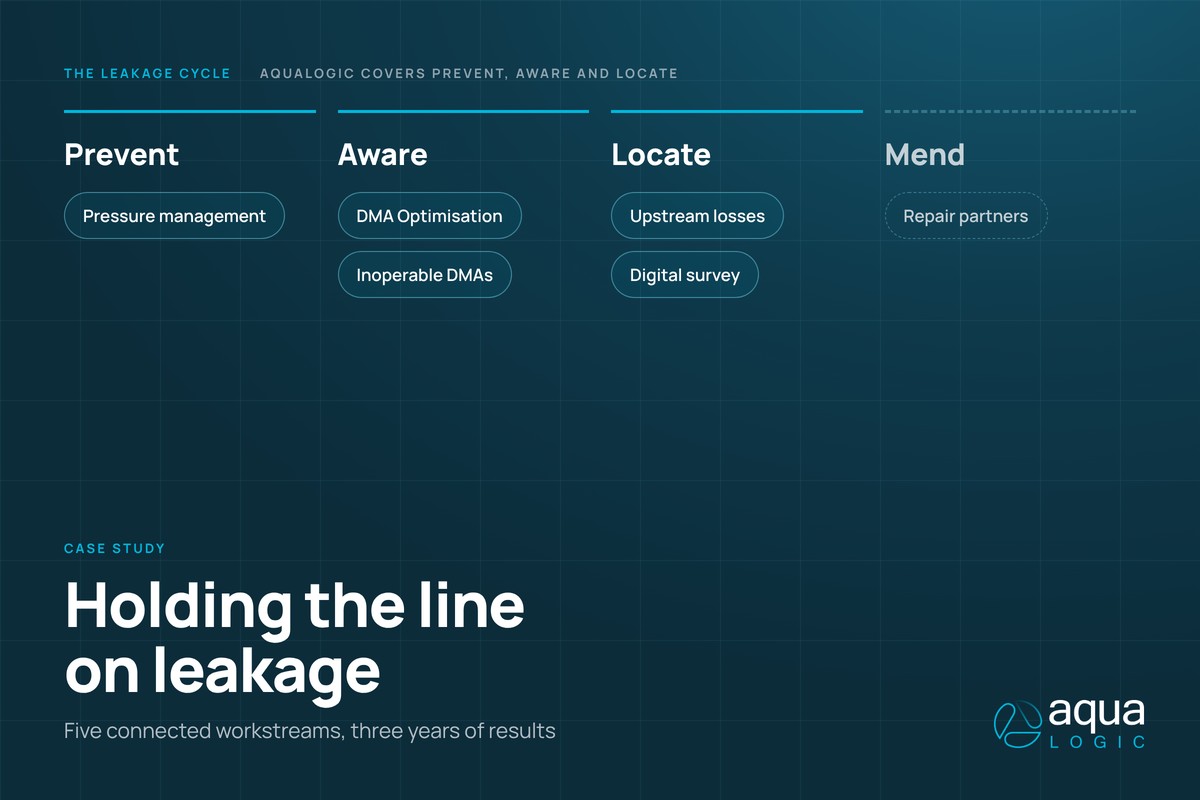
One programme, five workstreams
Aqualogic’s work for the client is built around the industry’s PALM framework: Prevent, Aware, Locate and Mend. Aqualogic covers the first three stages. Repairs are carried out by the client’s repair and maintenance partners, who turn located leakage into realised savings.
- 01Pressure management, PreventServicing pressure reducing valves, designing and installing new ones and deploying electronic controllers, so the network runs at the pressure customers need and no more.
- 02DMA Optimisation, AwareRevealing previously hidden leakage by combining advanced detection techniques with unaccounted-for water audits, meter performance checks, network integrity investigations and pressure optimisation.
- 03Inoperable DMAs, AwareMaintaining leakage control in DMAs where operability or data quality is compromised, ensuring leakage remains actively managed even when conventional DMA reporting is unreliable.
- 04Upstream losses, LocateFinding leakage on trunk mains and strategic mains outside the DMA network, where visibility is lowest.
- 05Digital survey, LocateLocating leakage across the largest share of the DMA estate, using iQuarius acoustic technology and a defined method for using it.
Each workstream does a different job. Run together, they mean leakage is prevented where possible, made visible where it was hidden, and found where it occurs.
The quarter
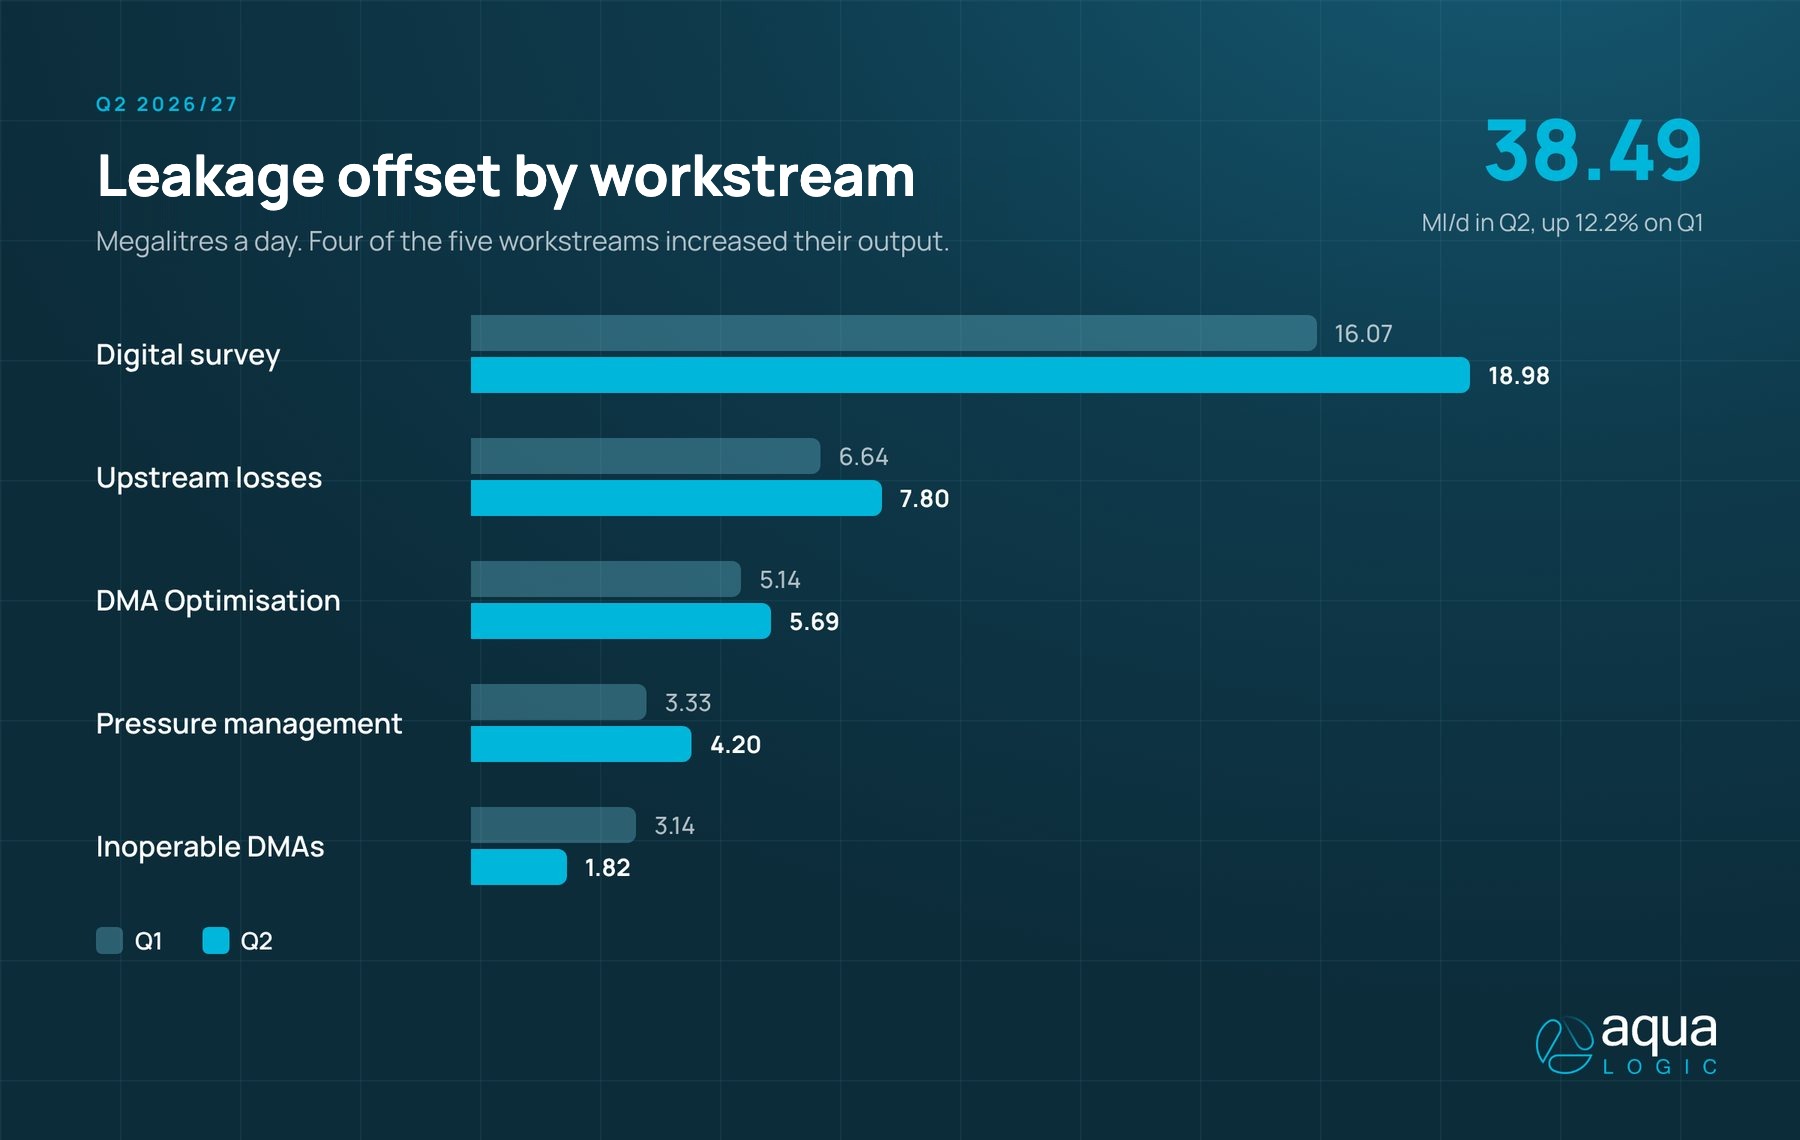
In the second quarter of the 2026/27 reporting year, the programme offset 38.49 megalitres a day of leakage increase, up from 34.32 in the first quarter. That is an increase of 12.2%. Four of the five workstreams increased their output, with inoperable DMA work the one area still being focused on.
Quarterly results matter, but the more useful evidence sits in the long-term trends.
Every fitting checked
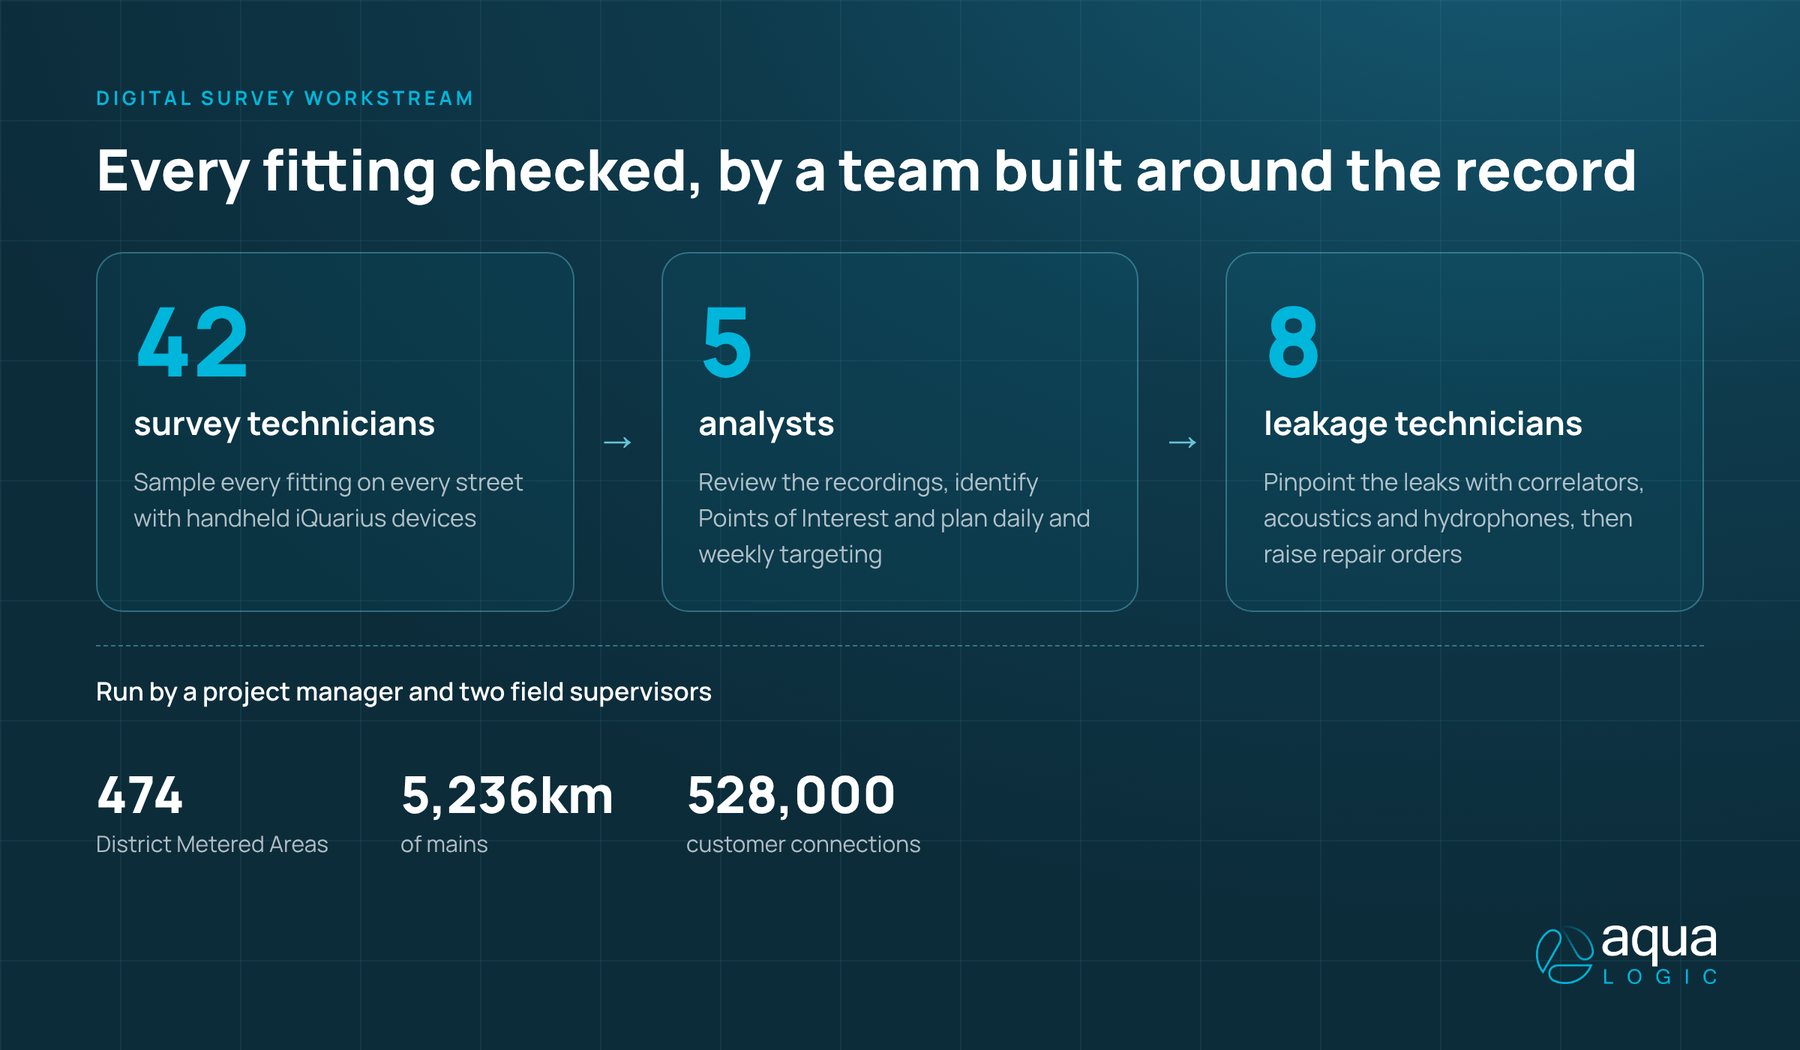
The digital survey workstream covers 474 DMAs, around 5,236km of mains and 528,000 customer connections. A project manager and two field supervisors run it. Forty-two Aqualogic technicians carry out continuous acoustic surveys with handheld iQuarius devices. Five analysts interrogate the data to identify Points of Interest and plan daily and weekly targeting. Eight experienced leakage technicians then pinpoint the leaks and raise repair orders.
The workstream is committed to 48 megalitres a day this year and, on the current run rate, is forecast to reach around 65.
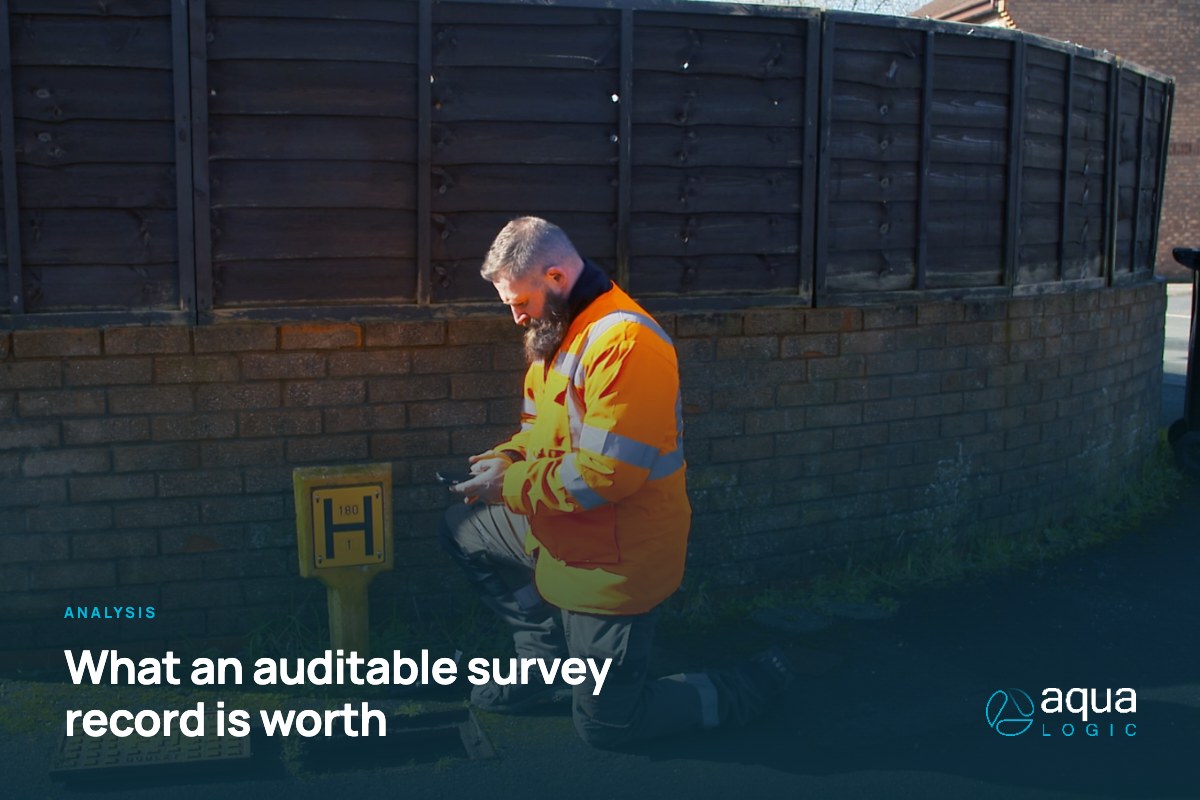
The method matters as much as the device. Technicians sample every fitting and walk every street, not only where a leak is suspected, and each sample is located and time stamped. That gives the analysts a complete record to work from and gives the client evidence of what was covered.
Over 2024 to 2026, leakage in the digitally surveyed DMAs has run around five times lower per customer connection than in the areas covered by standard leak detection. Measured per DMA, the standard areas run 4.3 times higher.
That needs one piece of context. The surveyed group includes a higher share of urban DMAs, because that is where the method is most effective. The lower levels reflect continuous survey suppressing the Natural Rate of Rise across nearly half the DMA estate.
The conclusion is not that this work can be scaled back because leakage is low. Low leakage there is the result of the work. The larger opportunity is applying the same data-led method to the areas where leakage remains higher.
What happens when activity pauses
Around 45,000 customer connections sit outside the reportable DMA network, served by 2,757km of trunk and strategic mains. Many trunk main meters are ageing or inoperable, so performance depends on experienced Aqualogic analysts reading flows, pressures and operating data together and adjusting targeting as conditions change.
Between October 2023 and September 2026, losses in the operable part of this network fell to around 64% of their starting level, a sustained reduction of more than 35%. Since winter 2023, the workstream has recovered 18.5 megalitres a day.
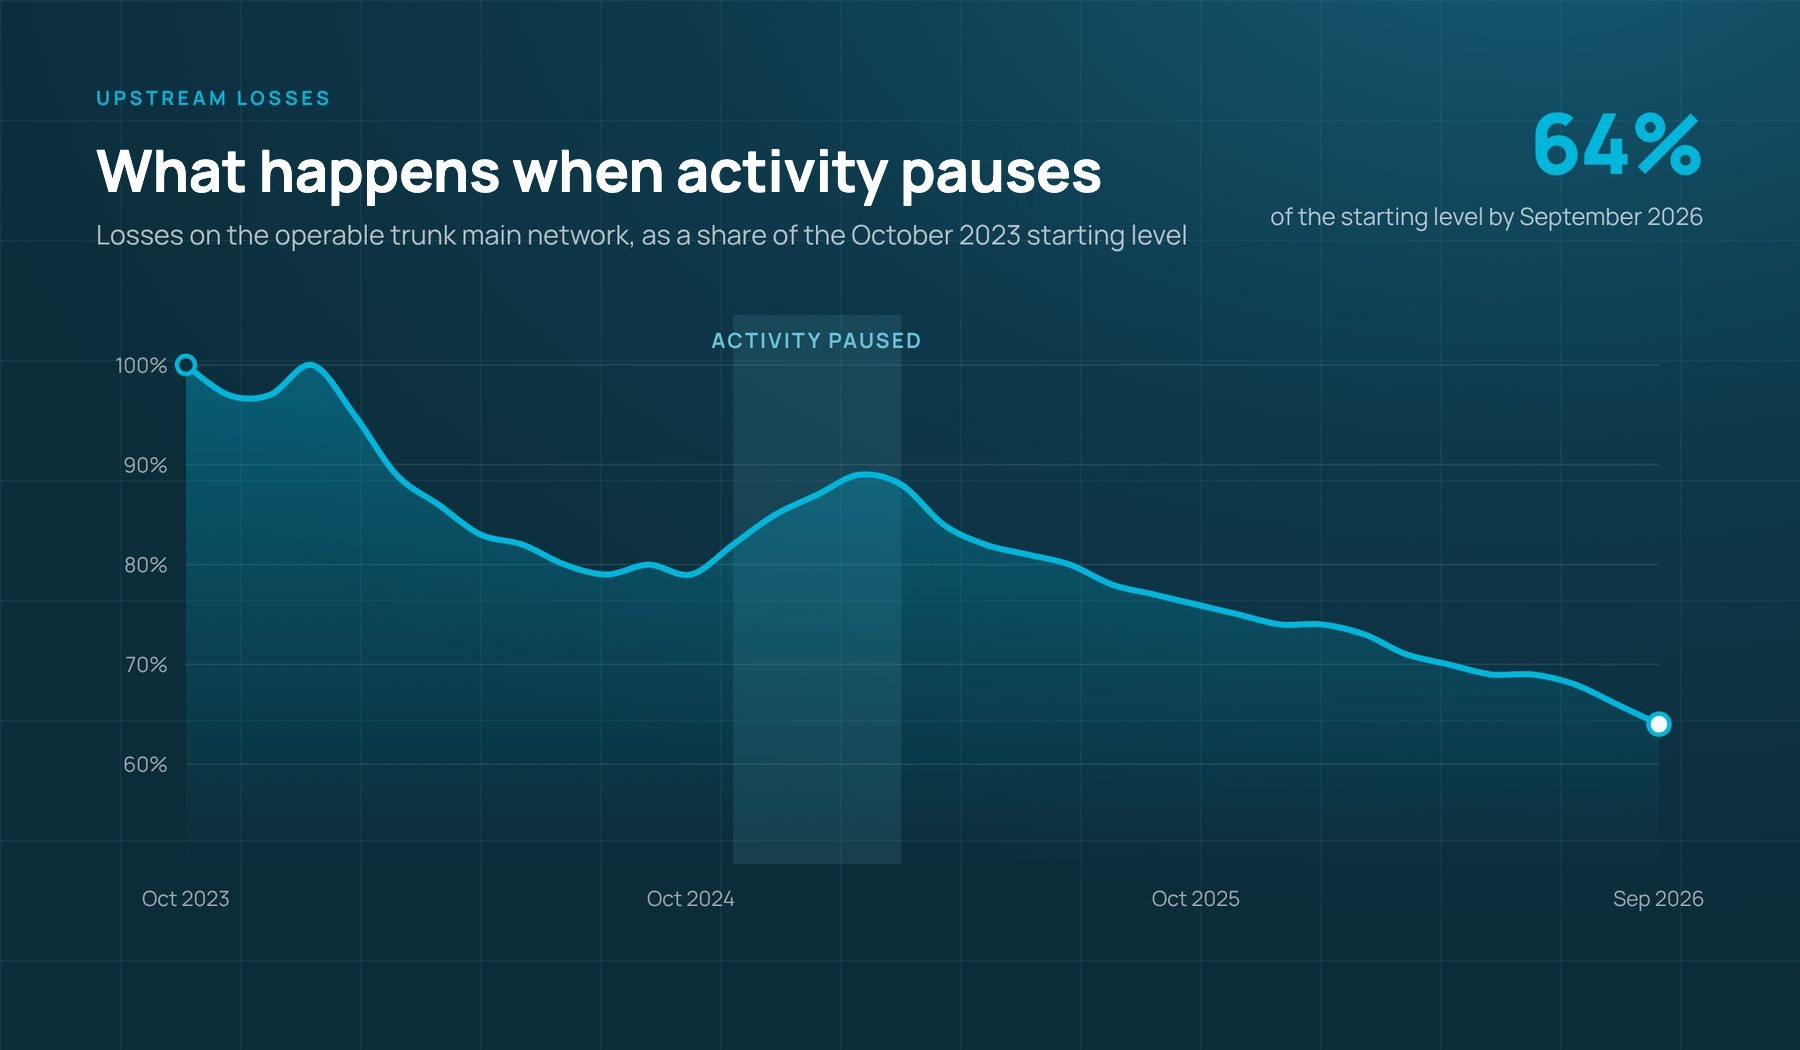
The trend also shows what happens when this activity is paused. Upstream activity was paused between November 2024 and March 2025 as resources were mobilised to other priority areas of the water network in response to winter outbreaks. During this period, upstream losses increased, demonstrating that the Natural Rate of Rise affects not only DMAs but the upstream network as well. When activity resumed, losses returned to their previous downward trend.
Because regulatory reporting estimates trunk main leakage rather than measuring it, much of this saving does not appear in reported leakage figures. It shows up instead as less water put into supply unnecessarily, and as more water kept in the system during dry, high-demand periods, when it matters most. That makes upstream loss work as much a water resources and resilience activity as a leakage one.
Prevention ahead of plan
Pressure management has run ahead of target throughout the period from April 2025 to September 2026, delivering around 19.2 megalitres a day of cumulative savings against a target of 17.1. That is about 12% above plan.
Unlike detection, the benefit lasts. Lower, steadier pressure reduces background leakage, suppresses new leaks and bursts, and extends the life of the assets across each pressure-managed zone.
Analysts and technicians together
Much of the programme’s value comes from analysts and field teams working on the same problem. A recent investigation in a large DMA of more than 5,500 properties showed how.
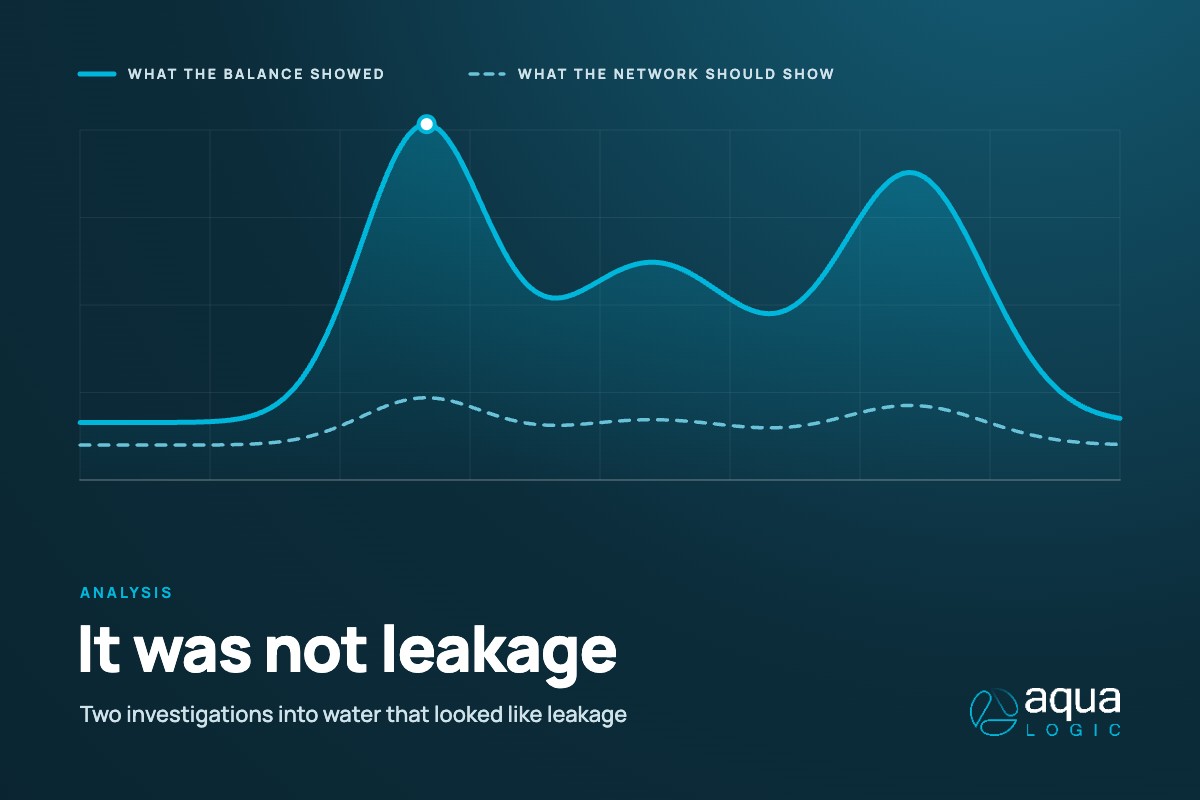
The DMA had long appeared to run above target. Rather than send in conventional leak detection, the team surveyed the whole area to establish a baseline, locating 24 leaks along the way, then assessed 39 non-household meters one by one, with the analyst supporting the field technician throughout. Five were logged. Two businesses alone accounted for more than 0.5 megalitres a day of consumption that had been counted as leakage. Once accounted for, it no longer hides the real leakage signal in that area. We wrote about it in more detail in It was not leakage.
What it proves
Leakage reduction is sustained work
Where activity continues, leakage stays down. Where it pauses, the Natural Rate of Rise shows itself quickly.
Connected beats separate
Pressure management, DMA performance, upstream losses and digital survey each answer part of the problem. The programme works because they are planned and managed as one.
Evidence matters as much as leaks found
A located, time-stamped survey record, verified DMA data and long-term trends give a water company something it can plan, report and invest against.
People make the method work
Analysts and field technicians working on the same problem turn data into leaks found and repairs raised.
Talk to us
Hold leakage down across the whole network
If you are weighing how to keep leakage down across a whole network, not just find this year’s leaks, we would be glad to talk it through.